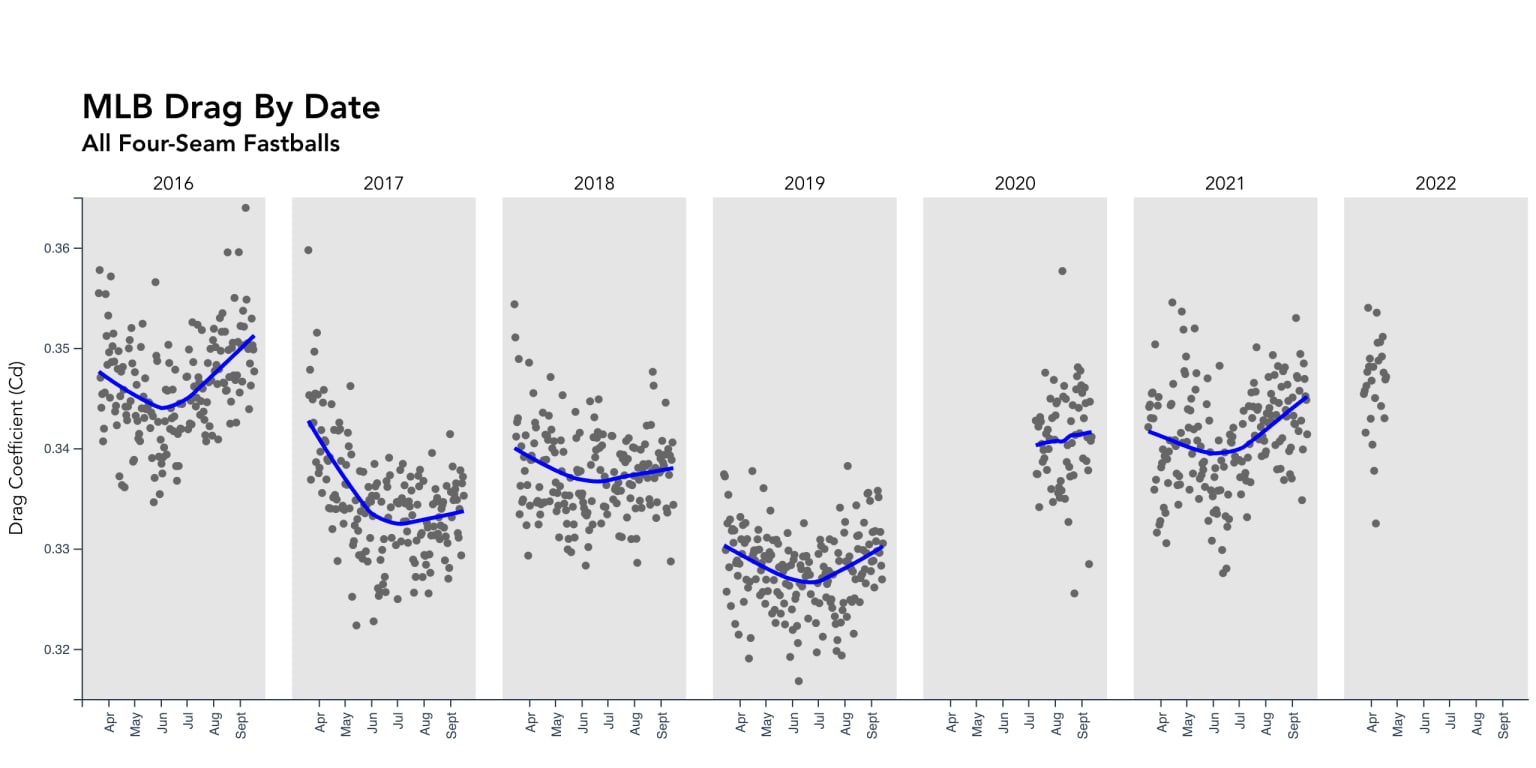
Data on the drag of MLB baseballs is now publicly available on Baseball Savant.
The new Drag Dashboard shows how the drag on the balls used in Major League games — which affects the distance the ball travels — has changed both from season to season and within seasons.
The drag coefficient of a baseball is one of two main factors driving the ball’s performance. It impacts how far the ball will carry once it’s hit. (The other is the coefficient of restitution, or “COR,” which impacts the exit velocity of the ball off the bat.)
A decrease in drag coefficient will cause an increase in batted ball distance, and vice versa. The general rule of thumb is: for a decrease in drag coefficient by 0.01, a ball hit with an exit velocity of 100 mph will travel approximately five feet farther. An increase of 0.01 in drag coefficient will decrease the batted ball distance by five feet.
So what does the Drag Dashboard show?
Statcast pitch tracking data can be used to estimate the drag coefficient of the baseball. The Drag Dashboard, which updates daily, shows the average drag coefficient of four-seam fastballs for every date of the regular season going back to 2016.
The Drag Dashboard can help fans answer questions about how the baseball has changed from year to year, or from day to day, by seeing whether there is more or less drag.
Fans who are interested in the drag of the baseball this season, or about historical context from previous seasons, can see the Drag Dashboard here. The public tool is part of MLB’s effort to be transparent about the performance of the baseball.
The method for measuring the baseball’s drag coefficient was developed by scientists from MLB’s Home Run Committee, and it is replicated here for the public to view.
The drag of the baseball does change from season to season, but the Home Run Committee found that the bigger variation is from baseball to baseball within an individual season. Part of that in-season variability is because significant parts of MLB baseballs are constructed by hand. Two baseballs from the same box can have different drag coefficients. The Drag Dashboard keeps track of how the drag on the ball is changing.
More context and information on the performance of the baseball is available on the Drag Dashboard page.
This news is republished from another source. You can check the original article here


